Newsroom
- IR
FY2017 Full-year Financial Results
May 15, 2018 | Recruit Holdings Co., Ltd.
Recruit Holdings Co., Ltd. hereby announces financial results for FY2017. Please see below for the details.
1. Highlights of Financial Results for the year Ended March 31, 2018
-
Revenue, EBITDA and Adjusted EPS: Record- high results.
-
Strong revenue growth continued in HR Technology with +60.7% increase in US dollar terms*¹.
-
Overseas revenue increased to 46% in FY2017, from 43% in FY2016, of total revenue
-
Group Reorganization to accelerate the strategic execution of each SBU
*1 This is the financial results of Indeed, which differ from the IFRS-based consolidated financial results of Recruit Holdings Co., Ltd. due to differences in consolidation methodologies.
2. Consolidated Financial Results for the year Ended March 31, 2018
(JPY Bn)
| FY2016 | FY2017 | |||
|---|---|---|---|---|
| Full-year | Full-year Forecasts*¹ |
Full-year Results | YoY Change |
|
| Revenue | 1,941.9 | 2,166.0 | 2,173.3 | +11.9% |
| EBITDA | 232.2 | 258.0 | 258.4 | +11.3% |
| EBITDA margin | 12.0% | 11.9% | 11.9% | -0.1pt |
| Adjusted profit | 133.7 | 142.5 | 144.9 | +8.3% |
| Adjusted EPS(JPY) | 80.06*² | 85.30 | 86.74 | +8.3% |
| Dividend per share(JPY) | 21.67*² | 22.00 | 23.00 | - |
*1 Announced on February 14, 2018
*2 Assuming a three-for-one
stock split of its common stock on July 1, 2017 was implemented at the
beginning of FY2016.
-
Adjusted profit, which excludes non-recurring income and losses, grew 8.3% to 144.9 billion yen, and adjusted EPS also increased 8.3% to 86.74 yen per share. We set adjusted EPS as a key performance indicator for management, and target 3 years Compounded Annual Growth Rate (CAGR) of high single digits from FY2016 to FY2018 in the mid-term management strategy. In FY2017, the second year of the targeted period, we achieved 8.3% growth in adjusted EPS, following 15.1% in FY2016, which was good progress towards the mid-term target.
3. Operating Results by Segment for the Fourth Quarter Ended March 31, 2018
Overview of Operating Results by segment
(JPY Bn)
| FY2016 | FY2017 | ||||
|---|---|---|---|---|---|
| Q4(Jan.-Mar.) | Q4(Jan.-Mar.) | YoY Change | Full-year | YoY Change | |
| Revenue | |||||
| Consolidated results | 518.9 | 556.4 | +7.2% | 2,173.3 | +11.9% |
| HR Technology | 39.3 | 61.9 | +57.5% | 218.5 | +64.7% |
| Media&Solutions | 175.9 | 181.2 | +3.0% | 679.9 | +3.3% |
| Staffing | 309.4 | 319.9 | +3.4% | 1,298.8 | +10.9% |
| Corporate Expenses/ Elimination | -5.7 | -6.6 | - | -24.0 | - |
| EBITDA | |||||
| Consolidated results | 42.6 | 42.7 | +0.2% | 258.4 | +11.3% |
| HR Technology | 3.7 | 7.3 | +94.1% | 30.6 | +83.3% |
| Media&Solutions | 24.5 | 27.8 | +13.5% | 156.1 | +3.1% |
| Staffing | 15.4 | 9.8 | -36.2% | 72.7 | +10.8% |
| Corporate Expenses/ Elimination | -1.0 | -2.2 | - | -1.0 | - |
Both revenue and EBITDA increased year on year in the HR Technology and Media & Solutions segment. In the Staffing segment, revenue increased but EBITDA decreased year on year, due to strategic investments to reinforce the Japan operations.
HR Technology
(JPY Bn, USD MM)
| FY2016 | FY2017 | ||||
|---|---|---|---|---|---|
| Q4(Jan.-Mar.) | Q4(Jan.-Mar.) | YoY Change | Full-year | YoY Change | |
| Revenue | |||||
| HR Technology | 39.3 | 61.9 | +57.5% | 218.5 | +64.7% |
| Reference: Revenue in US Dollars*¹ |
355 | 572 | +61.1% | 1,976 | +60.7% |
| EBITDA | |||||
| HR Technology | 3.7 | 7.3 | +94.1% | 30.6 | +83.3% |
*1 This is the financial results of Indeed, which differ from the IFRS-based consolidated financial results of Recruit Holdings Co., Ltd. due to differences in consolidation methodologies.
In the HR Technology segment, Q4 revenue increased 57.5% year on year, mainly due to a combination of new customer acquisition and expanding spend from existing customers. Quarterly revenue growth was 61.1% on a US dollar basis.
Quarterly segment EBITDA increased 94.1% year on year. To support future revenue growth, the HR Technology segment continued to invest in sales and marketing activities to acquire new users and customers, and in product enhancements to increase user and customer engagement.
Media&Solutions
(JPY Bn)
| FY2016 | FY2017 | ||||
|---|---|---|---|---|---|
| Q4(Jan.-Mar.) | Q4(Jan.-Mar.) | YoY Change | Full-year | YoY Change | |
| Revenue | |||||
| Media&Solutions | 175.9 | 181.2 | +3.0% | 679.9 | +3.3% |
| Marketing Solutions | 97.1 | 96.4 | -0.6% | 378.5 | +2.4% |
| Housing and Real Estate | 25.5 | 24.7 | -2.9% | 98.1 | -1.4% |
| Bridal | 13.0 | 13.1 | +0.7% | 55.4 | +1.6% |
| Travel | 13.9 | 14.2 | +1.6% | 58.8 | +0.8% |
| Dining | 9.5 | 9.7 | +2.1% | 37.3 | -0.3% |
| Beauty | 14.6 | 16.8 | +14.7% | 63.8 | +12.4% |
| Others | 20.3 | 17.8 | -12.5% | 64.8 | +3.2% |
| HR Solutions | 78.3 | 83.0 | +6.0% | 294.4 | +4.4% |
| Domestic Recruiting | 72.9 | 76.8 | +5.4% | 270.6 | +4.0% |
| Others | 5.3 | 6.1 | +14.0% | 23.7 | +9.9% |
| Corporate Expenses/ Eliminations | 0.4 | 1.7 | +287.3% | 7.0 | +7.0% |
| EBITDA | |||||
| Media&Solutions | 24.5 | 27.8 | +13.5% | 156.1 | +3.1% |
| Marketing Solutions | 10.8 | 15.5 | +43.5% | 95.2 | +9.4% |
| HR Solutions | 19.5 | 16.4 | -15.9% | 74.5 | -0.4% |
| Corporate Expenses/ Eliminations | -5.8 | -4.1 | - | -13.6 | - |
In the Media & Solutions segment, quarterly revenue increased 3.0%, and EBITDA increased 13.5% year on year. Quarterly results are summarized in the following three points.
First, in the Beauty business in Marketing Solutions, quarterly revenue grew 14.7% year on year, driven by an increased number of beauty salon clients mainly resulting from a continued effort to extend its reach to non-urban areas.
Secondly, in the Dining business in Marketing Solutions, quarterly revenue increased 2.1% year on year, with signs of returning clients using paid advertisements on its platform, resulting from our focus on solution driven sales by promoting cloud-based operational support services and providing data analysis to clients. The number of clients using our cloud-based Operational Support Package is growing steadily, with more than 18,000 paid clients as of the end of March 2018.
Thirdly, in domestic recruiting in HR Solutions, quarterly revenue recorded a strong growth of 5.4% year on year, against a backdrop of favorable market environment in Japan.
On the other hand, EBITDA in HR Solutions decreased 15.9% year on year, mainly due to increased marketing investment to attract users to support further growth.
Staffing
(JPY Bn)
| FY2016 | FY2017 | ||||
|---|---|---|---|---|---|
| Q4(Jan.-Mar.) | Q4(Jan.-Mar.) | YoY Change | Full-year | YoY Change | |
| Revenue | |||||
| Staffing | 309.4 | 319.9 | +3.4% | 1,298.8 | +10.9% |
| Japan | 122.7 | 128.9 | +5.1% | 509.2 | +9.9% |
| Overseas | 186.6 | 190.9 | +2.3% | 789.5 | +11.6% |
| EBITDA | |||||
| Staffing | 15.4 | 9.8 | -36.2% | 72.7 | +10.8% |
| Japan | 7.2 | 2.7 | -62.6% | 33.8 | +15.0% |
| Overseas | 8.1 | 7.1 | -12.7% | 38.9 | +7.4% |
Quarterly revenue increased 3.4%, and EBITDA decreased 36.2% year on year. In Japan operations, quarterly revenue increased 5.1% in a favorable business environment. EBITDA, however, decreased 62.6% due to the intensive investment mainly in advertisement to increase the number of registered agency workers in the Japan operations reflecting strong performance in the earlier quarters.
In overseas operations, quarterly revenue increased 2.3% year on year. Revenue for Q4 FY2017 was positively impacted by 4.9 billion yen as a result of foreign exchange rate movements. Excluding this impact, quarterly revenue declined 0.7%. Q4 EBITDA decreased 12.7% year on year. This was primarily resulting from a decrease in transactions with existing clients due to the challenging business environment in some industries in the United States.
4. Mid-term Strategy
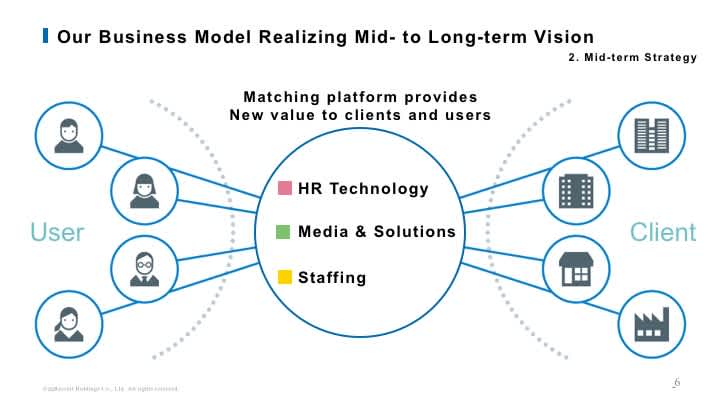
We aim to provide better services for both individual users and clients with our unique business model of providing Matching Platforms, to eliminate inconvenience and dissatisfaction from societies and individuals around the world.
Over the mid-term, positioning HR Technology as the highest growth segment, we will expand our businesses further in each of the three segments.
Mid-term Strategy by Segment
In the HR technology segment, we will look for opportunities to expand into other HR related businesses beyond job advertising by contributing to the efficiency of overall HR processes such as recruiting and hiring, while continuing to aggressively invest in our existing business to drive future growth.
In the Media & Solutions segment, we look to achieve sustainable revenue growth while maintaining a strong EBITDA margin. Toward this objective, we focus on strengthening our existing business further by expanding the operational support services to our clients, which enables them to reduce their workload, while enabling us to strengthen our relationship with them.
In the Staffing segment, we target stable growth in EBITDA on a global scale through our unique management methodology, Unit Management System.
HR Technology
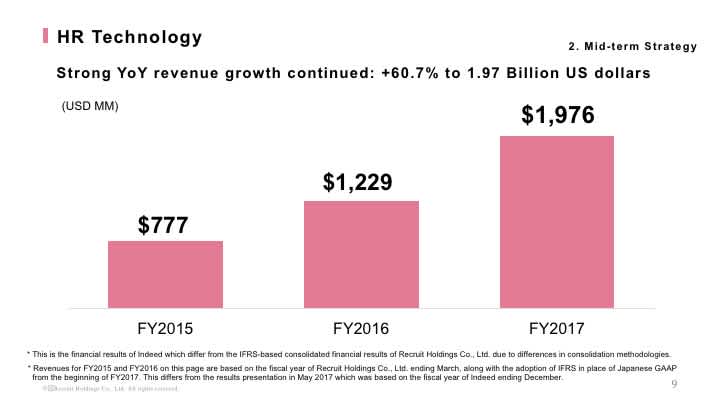
In the HR technology segment, we recorded continuous strong revenue growth, expecting to achieve the FY2018 revenue objective of more than 2 billion US dollars almost one year ahead of schedule.
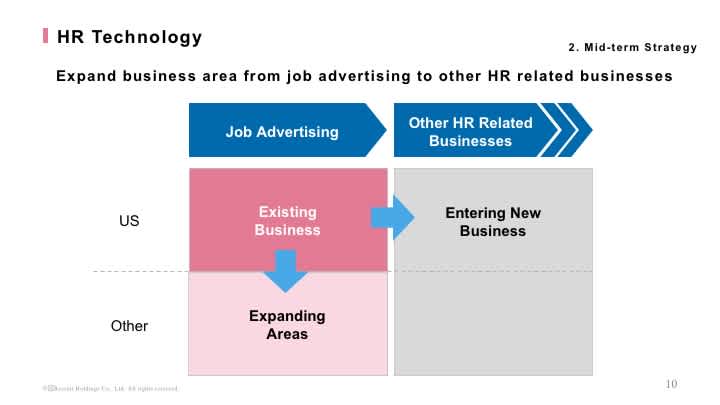
We look to establish efficient recruiting and hiring processes both for employer clients and job seekers by expanding other HR related businesses beyond job advertising. We believe strong opportunities exist to innovate other parts of the HR processes, by eliminating inconvenience and dissatisfaction in recruiting from companies, and in seeking a job from individuals.
HR Technology segment aims to drive future growth by investing in R&D or through M&A to create new and innovative ways to drive efficiencies in recruiting and hiring processes.
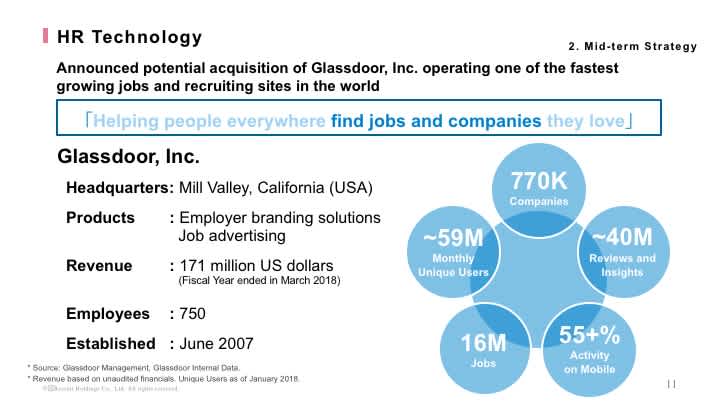
As announced on May 9, 2018, we signed a definitive agreement to acquire Glassdoor, Inc. (Glassdoor),headquartered in the United States, operating one of the fastest growing jobs and recruiting sites in the world. Glassdoor was established in 2007, with revenue of roughly 18.0billion yen translated from US dollar for the fiscal year ended in March 2018, and 59 million monthly unique users as of January 2018. The most remarkable feature of Glassdoor is its database of more than 40 million reviews and insights, which has a high profile especially in the United States.
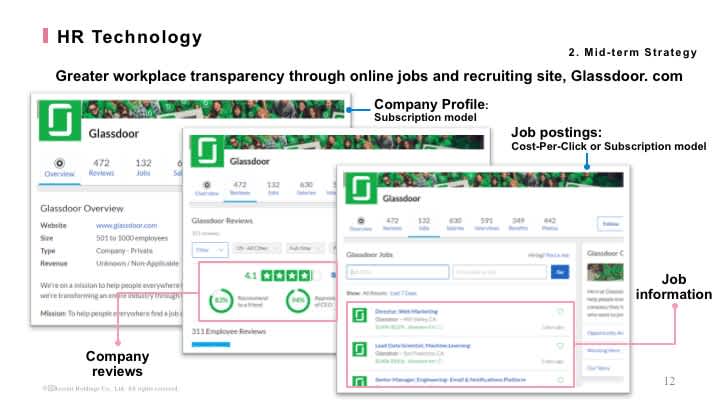
Glassdoor's revenue comes from employers who are looking to recruit and hire. Glassdoor offers employers opportunities to advertise jobs through Cost-Per-Click or subscription model, and to promote their brand to potential candidates through subscription model.
The HR technology SBU will be strengthened by welcoming a trusted and well-known brand. In addition, the Glassdoor team brings an experienced and outstanding team to join the Recruit Group. This potential acquisition will allow us to further strengthen, deepen and expand services provided to both job seekers and companies.
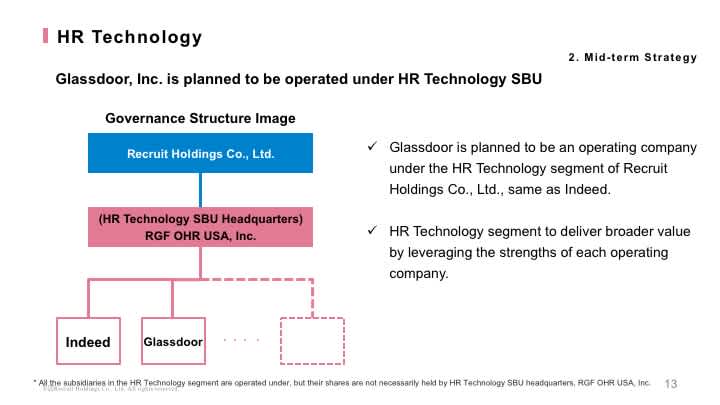
This is the governance structure after the potential acquisition. Glassdoor, together with Indeed, is planned to operate under the HR Technology segment of Recruit Holdings Co., Ltd., and we are not planning to send management from companies in the Recruit Group to Glassdoor. Glassdoor management will report to the CEO of HR Technology SBU Headquarters. This means Glassdoor will be managed in similar manner to Indeed from a governance perspective.
Media & Solutions
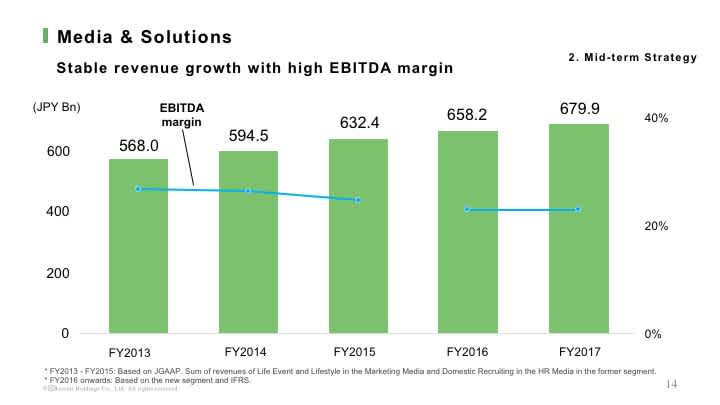
Media & Solutions business has achieved stable revenue growth by strengthening existing businesses and creating new businesses.
We expect to maintain a strong EBITDA margin within a range of 20% to 25%, including the impact of any future investment in new businesses we aim to accelerate.
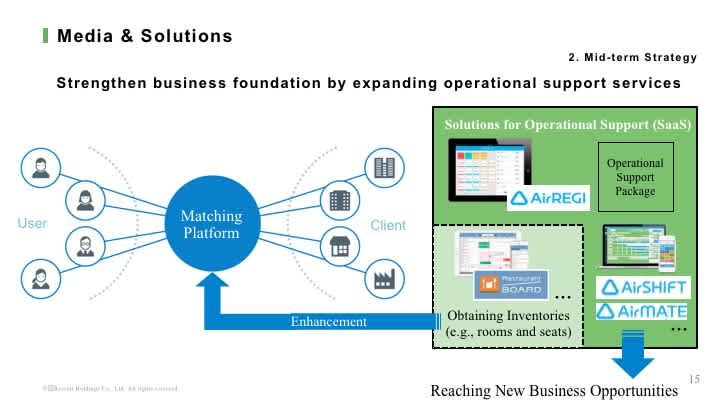
In Media & Solutions, we offer media services, and business solutions,
such as Matching Platforms connecting corporate clients and individual
users, and operational support services for corporate clients.
Our
competitive advantage in Media & Solution segment relies on the volume
and quality of real-time information such as hotel room vacancy and
availability of hair salon stylists provided by clients to our Matching
Platforms, which we call "inventory information". We therefore focus on
expanding operational support services, which enable us to grow our
unique database of information more efficiently, and particularly to
help our clients reduce their workload and improve operational
efficiency, mainly for small and mid-sized companies which comprise the
majority of our clients.
Currently, the number of restaurant operators using our cloud-based operational support services, Air Platform, is steadily growing. To expand the lineup of Air Platform services further, we also launched new services such as Air Shift, which is designed to help restaurant operators create, edit and share work schedules of their staff and Air MATE, which is an operational management support service for restaurant operators.
Staffing
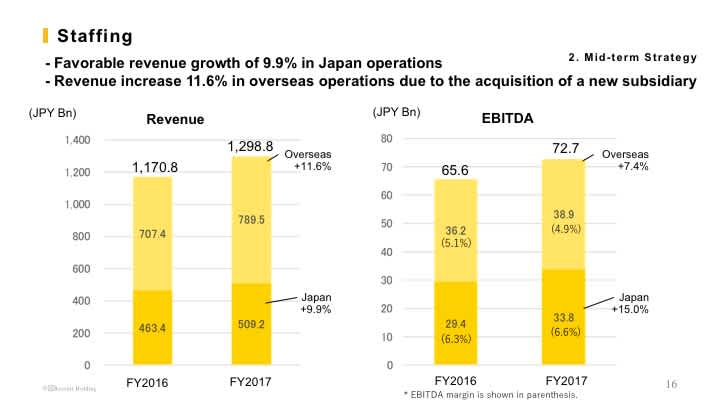
In Japan operations of the Staffing business, revenue grew 9.9%, and
EBITDA increased 15.0% year on year, supported by a favorable market
environment.
In overseas operations, revenue increased 11.6%,
mainly due to the full year contribution of Recruit Global Staffing B.V.
(formerly USG People B.V.) headquartered in the Netherlands, which
started to be consolidated in June 2016.
EBITDA increased 7.4%, with a slower growth rate than revenue, mainly resulting from a decrease in transactions with existing clients due to the challenging business environment in some industries in the United States. In Japan, demand for agency workers remains solid supported by a favorable market environment with a steady economic environment and workforce shortage due to a declining birthrate. In overseas, demand for agency workers remains steady, against a backdrop with strong economic environment in the United States, and solid economic environment in Europe which recovered from the economic crisis. We will continuously focus on EBITDA growth based on our unique management methodology, Unit Management System.
Group Reorganization
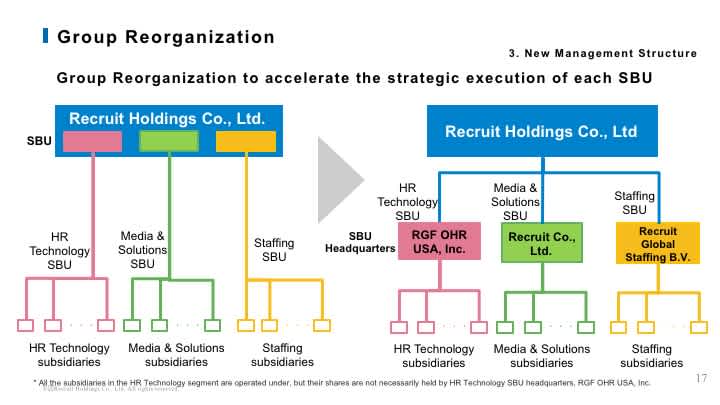
With the approval at Extraordinary General Meeting of Shareholders held in January 2018, we established new management structure.
Recruit Group carried out the Group Reorganization, establishing independent SBU Headquarters for each SBU, which executes the independent strategies of each SBU in a self-sustaining manner. Concretely, we have three SBUs; HR Technology SBU, which operates HR Technology related companies such as Indeed, an online job search engine and its related businesses. Media & Solutions SBU, which operates companies in Marketing Solutions and HR Solutions both in Japan and globally. Staffing SBU, operating companies in Staffing business in Japan and overseas
New management structure
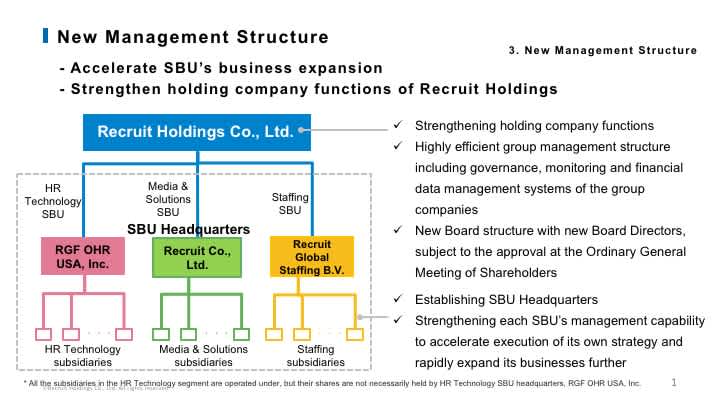
This new structure enables each SBU Headquarters to strengthen its management capability to accelerate execution of its own independent strategy and expand its businesses further quickly. Also, this enables our holding company to allocate its resources to plan strategies to increase long-term enterprise value such as long-term operational portfolio, as well as monitoring the group companies through its governance system and risk management structure.
Also, we will make changes to our Board of Directors, with some new
Board Directors, subject to the approval at the Ordinary General Meeting
of Shareholders scheduled in June 2018. We appointed Mr. Naoki Izumiya,
Chairman of Asahi Group Holdings, Ltd. and Mr. Hiroki Totoki, CFO of
Sony Corporation as new External Board Directors, and Mr. Rony Kahan,
co-founder of Indeed, Inc., as a new Non-Executive Board
Director.
We aim to create a sustainable increases in shareholders
value under the new Board structure.
5. Consolidated Financial Forecasts for FY2018
(JPY Bn)
| FY2017 | FY2018 | ||
|---|---|---|---|
| Full-year*¹ | Full-year Forecasts | YoY Change | |
| Revenue | 2,173.3 | 2,302.0 | +5.9% |
| EBITDA | 258.4 | 285.0 | +10.3% |
| EBITDA margin(%) | 11.9% | 12.4% | +0.5pt |
| Adjusted profit | 144.9 | 170.0 | +17.3% |
| Adjusted EPS(JPY) | 86.74 | 101.76 | +17.3 |
* Assumed foreign exchange rates for FY2018: JPY 106 per US dollar, JPY 131 per Euro, JPY 84 per Australian dollar.
Consolidated revenue is expected to increase 5.9% to 2 trillion 302.0 billion yen year on year, mainly due to anticipated high growth in the HR Technology segment.
EBITDA is expected to increase 10.3% to 285.0 billion yen compared to the previous fiscal year, due to continued high growth in HR technology and sustainable growth in the Media & Solutions segment. Both adjusted profit and adjusted EPS are expected to increase 17.3% year on year.
6. Financial Policy & Shareholder Returns
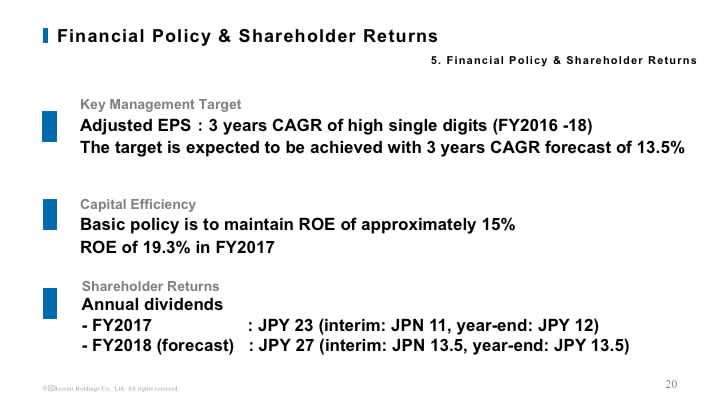
Lastly, I would like to explain our financial policy and shareholder returns.
We set a high single digit CAGR for adjusted EPS over the three years from FY2016 as a key management target. We expect the CAGR target set in the mid-term management strategy to be achieved in FY2018 as planned, as our 3-year CAGR is expected to be 13.5% from FY2016 to FY2018, derived from adjusted EPS forecast of 101.76 yen for FY2018.
For capital efficiency, we achieved ROE of 19.3% in FY2017, exceeding 15% set in our basic policy. We intend to maintain ROE of approximately 15% continuously.
For shareholder returns, we will pay annual dividends of 23 yen per
share for FY2017, consisting of an interim dividend of 11 yen per share
and a year-end dividend of 12 yen per share. The year-end dividend was
increased by 1 yen per share from the amount originally
forecasted.
Annual dividends forecasted for FY2018 is expected to
be 27 yen per share, a year-on-year increase of 4 yen per share,
consisting of an interim dividend of 13.5 yen per share and a year-end
dividend of 13.5 yen per share.
7. FAQ for Q4 and FY2017
Financial Results for FY2017
Consolidated Results
Q1:
Why did consolidated operating income in FY2017 decrease 0.9%
year on year, although consolidated EBITDA increased 11.3%?
A1:
This was mainly due to a non-recurring gain of 21.9 billion
yen resulting from the sale of a subsidiary, Yuko Yuko corporation,
recorded in other operating income in FY2016. Due to this effect, other
operating income in FY2016 was 24.3 billion yen, while other operating
income in FY2017 was 5.7 billion yen, which led to a lower year-on-year
growth rate in consolidated operating income. Adjusted operating income
excluding this one-time impact increased 11.2% year on year.
Q2:
Why did profit attributable to owners of the parent for
FY2017 increase 11.0% year on year, although operating income for the
year decreased 0.9%?
A2:
Profit attributable to owners of the parent benefited from
lower income tax expense mainly resulting from tax reforms in the United
States and European countries, and a sale of subsidiaries.
Q3:
What is the reason for slower EBITDA growth of 0.2% year on
year in Q4 FY2017 compared to previous quarters of the fiscal
year?
A3:
Reflecting the strong performance for the nine months in
FY2017, marketing investments were accelerated in Q4 for further growth,
mainly in Japan operations of the Staffing business.
Q4:
Why did consolidated operating income decrease 1.7% year on
year in Q4, although consolidated EBITDA increased 0.2%?
A4:
This is mainly due to an increase in depreciation and
amortization expense by 10.2% year on year in Q4. This is primarily
related to an increase in capital expenditure on new offices in the HR
Technology segment, and increased software investment in the Media &
Solutions segment.
Q5:
Why did profit attributable to owners of the parent for Q4
increase 30.6% year on year, although operating income decreased
1.7%?
A5:
Profit attributable to owners of the parent for Q4 benefited
from lower income tax expense mainly resulting from tax reforms in the
United States and European countries, and a sale of subsidiaries.
Q6:
Why was year-on-year growth rate in adjusted profit slower
than profit attributable to owner of the parent in Q4?
A6:
This was mainly due to a higher tax exemption amount in Q4,
which led to lower Adjusted profit due to tax reconciliation compared to
the same period of the last fiscal year.
Please refer to the following definition of adjusted profit and adjustment items; - Adjusted profit = profit attributable to owners of the parent ± adjustment items (excluding non-controlling interests) ± tax reconciliation related to certain adjustment items - Adjustment items = amortization of intangible assets by acquisitions ± non-recurring income/losses
Q7:
Why did advertising expense increased year on year in
Q4?
A7:
The increase in advertising expense mainly resulted from
ongoing investment in marketing activities in the HR Technology segment
to acquire new users and customers, and in the Staffing segment to
increase the number of registered agency workers in Japan
operations.
Q8:
How much was the impact of foreign exchange rate movements on
consolidated revenue?
A8:
The positive impact of foreign exchange rate movements on Q4
revenue was 4.9 billion yen. The positive impact on full-year revenue
was 56.5 billion yen in FY2017.
HR Technology
Q9:
Revenue for FY2017 on a US dollar basis increased 60.7% in HR
Technology. What drove continued strong revenue growth?
A9:
The strong revenue growth was mainly driven by a combination
of new customer acquisition and expanding spend from existing customers,
against the backdrop of a favorable economic environment and strong
labor market.
Q10:
What is the difference in revenue growth rates between the
US and Non-US in FY2017?
A10:
HR Technology continued to achieve strong revenue growth in
the US. However, the revenue growth rate in non-US markets was higher
than in the US, particularly driven by strong performance in Japan, UK,
Canada and Germany. Overall, the Non-US revenue growth rate is following
a similar trajectory to what the US experienced a few years ago. We do
not disclose revenue by regions.
Q11:
Why did Q4 EBITDA margin in HR Technology decrease
sequentially to 11.9% compared to Q3?
A11:
To support future revenue growth, the HR Technology segment
continued to invest in sales and marketing activities to acquire new
users and customers, and in product enhancements to increase user and
customer engagement. We expect EBITDA margins will fluctuate each
quarter based on timing of these investments for growth, but FY2017
EBITDA margin was 14.0%, which is within the target range of 10% to 20%
on an annualized basis, as was previously communicated.
Q12:
How many unique visitors did Indeed reach? Please also
provide an update on the number of resumes, employees and
offices.
A12:
The number of unique visitors reached a significant
milestone of 250 million in January 2018. The number of resumes uploaded
to its platform was approximately 120 million as of March 2018. Indeed
had more than 6,100 employees and 27 offices globally as of the end of
March 2018.
Q13:
Was there any change in competitive environment in HR
Technology in Q4?
A13:
There was no significant change in business performance and
operational trend in Q4, as evidenced by year-on-year revenue growth of
61.1% on a US dollar basis.
Media & Solutions
Q14:
Why did EBITDA for HR solutions decrease 0.4% in FY2017 and
15.9% in Q4?
A14:
Reflecting favorable growth trend for the nine months in
FY2017, HR Solutions made strategic investments actively to acquire more
users in domestic recruiting business for future growth given the
favorable employment environment in Japan, which led to the decrease in
EBITDA both in Q4 and the full year.
Q15:
Why did EBITDA in Marketing Solutions increase 43.5% year on
year in Q4?
A15:
Quarterly EBITDA for Marketing Solutions increased mainly
due to lower marketing expense to attract users in the Media &
Solutions, and increased EBITDA primarily in the Beauty subsegment,
compared to the same period of the previous fiscal year.
Q16:
What was the reason behind the year-on-year decrease in
revenue in the Housing and Real Estate business both in Q4 by 2.9% and
in the full year by 1.4%?
A16:
The decrease in Q4 revenue year on year was primarily due to
the absence of revenue from Recruit Forrent Insure Co., Ltd., a
subsidiary in Housing and Real Estate business which was sold in October
2017. Excluding the impact of the sale of approximately 1.6 billion yen
quarterly revenue in Q4 increased 3.9% year on year. Full-year revenue
also decreased year on year, mainly due to the impact of the sale of the
subsidiary mentioned above of approximately 3.3 billion yen, as well as
the absence of a one-time revenue increase of 2.6 billion yen associated
with the contract change in Q1 FY2016. Excluding these one-time factors,
revenue for the full year increased 4.8% year on year.
Q17:
Why did full-year revenue in the Travel business increase
only 0.8% year on year?
A17:
This was mainly due to a non-recurring gain recorded in July
2016 resulting from the sale of a subsidiary, Yuko Yuko corporation.
Excluding the impact of the sale of 2.4 billion yen, full-year revenue
increased 5.2% year on year.
Q18:
Why did Q4 revenue in the Travel business grow slower at
1.6% year on year compared to 5.3% in Q3?
A18:
Travel business carried out marketing promotions to attract
customers in Q4 in both FY2017 and FY2016. However, the timing of
promotions in Q4 F2017 was slightly delayed along with the associated
impact which resulted in a slower year on year growth rate in Q4
FY2017.
Q19:
Why did full-year revenue in the Dining business decrease
0.3% year on year?
A19:
Restaurant operators faced a challenging environment mainly
due to the workforce shortage in Japan throughout the fiscal year. Under
such environment, a few large clients were forced to limit their
spending on sales promotion which led to a decrease in full-year
revenue. However, the number of the paid clients for Operational Support
Package in the Dining business exceeded 18,000 as of the end of March
2018, showing steady growth. The revenue from Operational Support
Package, one of the services provided for restaurant operators through
Air Platform, is recorded in Others subsegment in Marketing Solutions.
Full-year revenue combining the Dining and operational support package
business increased approximately 7.9% year on year.
Q20:
Why did Q4 revenue in the Dining business increase 2.1% year
on year, reversing a downward trend in the earlier quarters in
FY2017?
A20:
The business environment for restaurant operators continues
to be challenging. Meanwhile, the Dining business strengthened its
relationship with clients by focusing on solution driven sales, by
promoting Air Platform, a cloud-based operational support services, and
by providing clients with analysis of data accumulated on its online
platform, Hot Pepper Gourmet. As a result, there were signs of clients
returning to use paid advertisements on its platform which led to the
revenue increase year on year. The revenue from Operational Support
Package, one of the services provided for restaurant operators through
Air Platform, is recorded in Others subsegment in Marketing Solutions.
Q4 revenue combining the Dining and operational support package business
increased approximately 10.3% year on year.
Staffing
Q21:
What was the reason for slower quarterly revenue growth rate
of 5.1% in Q4 in Japan operations in Staffing, compared to double digit
growth in the nine-month period of FY2017?
A21:
The Japanese staffing market continues to expand as
evidenced by the increasing number of active agency workers, which grew
5.5% from October to December 2017, compared to the same period of the
previous year. In this environment, the number of active agency workers
registered with the Staffing business also increased, which led to the
revenue increase in Q4. The revenue growth decreased sequentially in Q4
primarily due to the fact that there were two fewer business days in the
quarter compared to the same period of the previous year.
Q22:
Why did quarterly EBITDA for the Japan operations decrease
significantly in Q4, and why did quarterly EBITDA margin also
decrease?
A22:
This was mainly due to accelerated investment in
advertisement to increase the number of registered agency workers in the
Japan operations, leveraging the favorable market environment.
Q23:
What was normalized revenue in overseas operations in the
Staffing segment, excluding the effect of foreign exchange rate
movements and acquisitions?
A23:
Foreign exchange rate movements had a positive impact on
quarterly revenue of 4.9 billion yen in Q4. Since there was no
acquisition in Q4, normalized revenue excluding the positive effect of
exchange rate movements decreased 0.7% year on year. This was primarily
due to its operating focus on profitability, and a decrease in
transactions with existing clients resulting from the challenging
business environment especially in the Oil & Gas industries in the
United States.
For the full year, normalized revenue in overseas operations of the Staffing segment declined 2.6% year on year, excluding the positive impact of foreign exchange rate movements of 47.6 billion yen, and the positive impact of 52.7 billion yen due to the full year contribution of Recruit Global Staffing B.V. (former USG People B.V.) which started to be consolidated in June 2016.
Q24:
Why did quarterly EBITDA for the overseas operations
decrease in Q4 year on year, and why did quarterly EBITDA margin also
decrease?
A24:
The overseas operations continue to focus on profitability
improvement based on Unit Management System. However, quarterly EBITDA
margin for Q4 decreased due to a decrease in transactions with existing
clients resulting from the challenging business environment in the
United States.
Full-Year Forecasts for FY2018
Q25:
Why is year on year revenue growth rate in FY2018 forecast
expected to be 5.9%, lower than 11.9% in FY2017?
A25:
This is mainly due to the impact of new acquisitions.
Revenue for FY2017 had a positive impact of 52.7 billion yen due to full
year contribution of Recruit Global Staffing B.V. (former USG People
B.V.), which was consolidated from June 2016. In FY2018, on the other
hand, positive impact on revenue due to the planned acquisition of
Glassdoor, Inc. is expected to be approximately 16.0 billion yen.
Also, difference in foreign exchange rate affects the consolidated revenue growth rate forecast. Assumed foreign exchange rate for FY2018 forecasts is 106 yen per US dollar, while exchange rate effects on revenue for FY2017 was 110.85 yen per US dollar, which has negative impact on translation of US dollar revenue into in the yen-based consolidated revenue.
Q26:
Why is year-on-year EBITDA growth rate for FY2018 expected
to be 10.3%, higher than revenue growth rate forecast of 5.9%?
A26:
This is mainly due to revenue ratio from the segments with
higher EBITDA margin, HR Technology and Media & Solutions, is expected
to increase in FY2018, compared to FY2017. Also, SG&A ratio is expected
to be lower in FY2018 resulting from lower advertising expense, while
marketing investments were accelerated in FY2017 primarily in the Japan
operations of the Staffing segment to attract new agency workers.
Q27:
Why is profit attributable to owners of the parent is
expected to increase 0.9% year on year, while operating income is
forecasted to increase 9.5%?
A27:
This is due to expected higher tax expense in FY2018,
compared to the previous fiscal year. In FY2017, profit attributable to
owners of the parent benefited from lower income tax expense mainly
resulting from tax reforms in the United States and European countries,
and a sale of subsidiaries. As no such impact is assumed, income tax
expense is expected to rise in FY2018.
Q28:
What is the outlook by segment for FY2018?
A28:
In the HR Technology segment, it is difficult to predict
future growth rates due to the rapidly evolving Internet business. We
are investing aggressively to continue growing significantly on an
annual basis assuming the favorable economic environment continues, but
the growth rate may be lower than last year given the current size of
the segment. EBITDA margin is expected to stay within a range of 10% to
20% on an annual basis. The impact of the planned acquisition of
Glassdoor, Inc. includes estimated revenue of approximately 16.0 billion
yen, and EBITDA of approximately -3.0 billion yen for FY 2018. -3.0
billion yen.
In the Media & Solutions, revenue is expected to increase low to mid single digits year on year, and EBITDA is expected to increase high single digits.
Revenue in the Staffing business is expected to increase low single digits year on year, and EBITDA is expected to increase high single digits.
8. Video
9. Results Materials
Latest
Investors' Kit(3.0 MB)(ZIP)
Supplemental
Financial Data(313 KB)(Excel)
Questions
at Earnings Results (185 KB)
Disclaimer
In preparing these materials, Recruit Holdings Co., Ltd.
relies upon and assumes the accuracy and completeness of all available
information. However, we make no representations or warranties of any kind,
express or implied, about the completeness and accuracy. This presentation
also contains forward-looking statements. Actual results, performance and
achievements are subject to various risks and uncertainties. Accordingly,
actual results may differ significantly from those expressed or implied by
forward-looking statements. Readers are cautioned against placing undue
reliance on forward-looking statements.
Third parties are not permitted
to use and/or disclose this document and the contents herein for any other
purpose without the prior written consent of Recruit Holdings Co.,
Ltd.